The way of the repertory of work.
TREATMENT OF SPECTRA LHIRES
Procedure with Iris/SPiris
Synopsis
1.INTRODUCTION
2. LAUNCHING OF THE SOFTWARE AND REGLAGES
3. AUTOMATIC TREATMENT OF SPECTRA 2400
TRAITS/MM
3.1. Treatment of the spectrum of Gamma
Case
3.2. Treatment of the spectrum of 64 Ser
4. AUTOMATIC TREATMENT OF SPECTRUM 1200
TRAITS/MM
4.1. Treatment of the spectrum of Altair
4.2. Treatment of the spectrum of
HD173292
5. SEMIAUTOMATIC TREATMENT OF THE SPECTRA
2400 TRAITS/MM
5.1. Organization of the data
5.2. Calculation of the images Masters
5.2.1. Image of offset
5.2.2. Image of dark
5.2.3. Images flat-field
5.3. Treatment of the Altair star
5.4. Treatment of star HD192625
5.5. Treatment of the star 55 Cyg
5.6. Treatment of the star Sco Delta
5.7. Calculation of a spectrum of level
1b
6. SEMIAUTOMATIC TREATMENT OF THE SPECTRA
1200 TRAITS/MM
6.1. Calculation of the images Masters
6.2. Pretreatment of the spectrum of
Altair
6.3. Spectral calibration
6.4. Correction of the instrumental
response under VisualSpec
6.5. Treatment of star HD174237
6.6. Treatment of star HD174512
1. INTRODUCTION
This document presents a procedure of pretreatment of spectra LHIRES with the SPiris software. The elementary use of this last (or Iris) is pre-necessary to be able to read the tutorial.
The part of the treatment described relates to the passage of the rough images with two dimensions (2d) until the extraction of the spectral profile gauged spectralement.
The spectra proposed in example (and that you can download) were acquired with spectrograph LHIRES III assembled to the hearth f/10 of a telescope Celestron 11. The network used is either the 1200 traits/mm (dispersion of 0,344 A/pixel), or 2400 traits/mm (dispersion of 0,115 A/pixel). The camera is Audine equipped with a CCC Kodak KAF-0402ME. The slit of entry is regulated over a width of 26 microns. The area of the spectrum observed is centered on the Halpha line. The resolution is of the R=15000 order with the network of 2400 traits/mm. The observatory is located in a place severely polluted by the parasitic light, not far from the town of Toulouse.
2. LAUNCHING OF THE SOFTWARE AND REGLAGES
This tutorial is based on the SPIris software. SPIris is a alégée version of Iris, primarily centered on the data processing spectral. To click here to download SPIris.
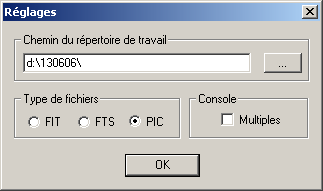
To launch the SPIris program, then to indicate which is your repertory of work (i.e. the repertory which contains the images to be treated). For example if the images are in the repertory "d:\130606" (this name of repertory is the date of observation), to open limp it of Réglages dialogue... of small Fichier and to fill it in the following way:
The way of the repertory of work.
To also indicate the type of file image, here of the images to the format owner PEAK.
To close limps it of dialogue while clicking on OK. You beings pret to treat the spectra.
The spectra proposed in example (and that you can download) were acquired in the night from the 13 to June 14, 2006 with spectrograph LHIRES III assembled to the hearth f/10 of a telescope Celestron 11. The network used is the 2400 traits/mm. The camera is Audine equipped with a CCC Kodak KAF-0402ME. With this equipment, spectral dispersion reverses average is 0,115 A/pixel. The slit of entry is regulated over a width of 26 microns. The resolution waited is R=15000. The observatory is close to the town of Toulouse.
3. AUTOMATIC TREATMENT OF SPECTRA 2400 TRAITS/MM
3.1. Treatment of the spectrum of the star Gamma Case
We treat 7 spectra of the star Be Gamma Cases, carried out in the night from the 10 to June 11, 2006. The unit exposure time is 180 seconds.
To download these 7 spectra, to click here (to decompress the files images in your repertory of work).
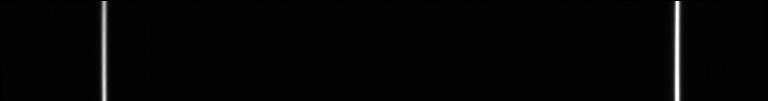
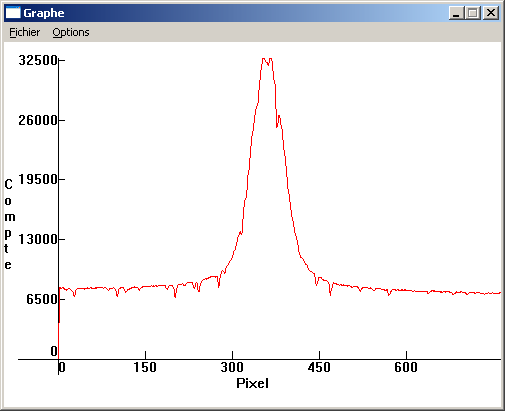
Here one of these spectra rough:
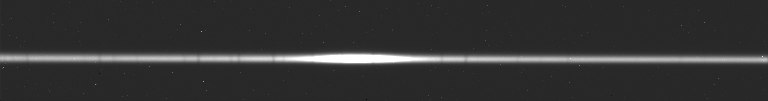
These spectra have for noncredits "gcas -". That means that the files are named gcas-1, gcas-2..., gcas-7.
To notice that the images are fenétrées with the format 768 pixels X 100 pixels as of acquisition. This size is sufficient to record the possible totality of the spectrum following the spectral axis (horizontal). The size of 100 pixels along the transverse axis (vertical) is sufficient to release suffisemment from space around the spectrum to be able to measure the bottom of sky. Well on, that also makes it possible to preserve space of storage and accéler the treatments.
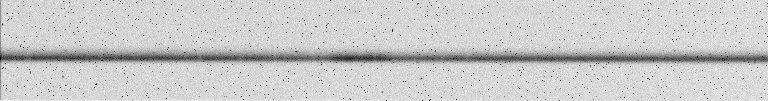
One notices in the rough image the intense emission of the Halpha line in the center and some brilliant points which had with the thermal signal. One guesses also narrow lines, caused by the steam present in our own atmosphere. They are lines known as telluric. They many and are well marked around the Halpha line. They can disturb the interpretation of the true spectrum of star, but here, they will be our to combine to enable us to calibrate the spectrum in wavelength. To the practice of reconnaitre these lines should be taken. One in particular. It is located on the right Halpha line, on its red side, identified on the following image:
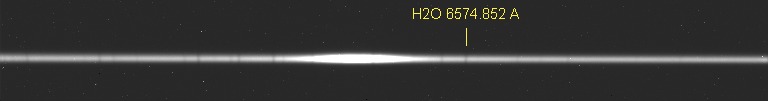
This line fine, the last one marked well while going towards the red, is located at the wavelength of 6574,852 A. With the pointer mouse to roughly raise the position of this line in pixel following the spectral axis (axis X, horizontal). You can measure this position with 3 or 4 pixels near, SPIris will refine to him even this result later. In the example we have X = 468. To retain this position well.
To notice that the axis of dispersion is quite horizontal, one took care with that at the time of the adjustment of the spectragraphe (by directing camera CCC).
Just after the observation of Gamma Case, we carried out a spectrum of the lamp neon. It has as a name gcas_neon-1. Here this spectrum:
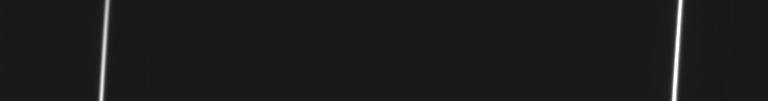
To download this spectrum of the lamp neon, to click here.
It is noted that the spectral lines are inclined, which is a characteristic of spectrograph LHIRES III. There is nothing abnormal with that. By image processing, we will have the occasion to rectify them. It is necessary for us for that to measure the angle of inclination of the lines compared to the vertical. We will see how to proceed in the continuation of this tutorial, but immediately give the angle of inclination result = -3.6° (one calls also it is angle the angle of slant). The order on line slant (or limps it of dialogy Slant of a spectrum 2d... which can be open since small Spectro) makes it possible to rectify the lines, and to possibly evaluate the angle by successive tests:
> slant 50 -3.6
The first parameter of this order is the co-ordinates vertical of the center of the image (100/2). The second parameter is the angle of slant. The result:
We also have the three usual images to carry out the pretreatment: the image of offset, the image of dark (chart of the thermal signal), the image of the flat-field (uniform beach of light).

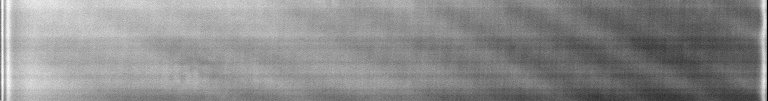
The chart of the signal of offset.
The image of the dark
The image of the flat-field
The files images corresponding are named in a natural way: offset; dark and flat. To download these three files, to click here.
We need a fourth file to perfect the treatment, known as cosmetic file. This file is optional, but it makes it possible to treat the difficult cases of thermal hot points very intense or the problem of columns défficientes of sensor CCC. This file, which one names in a standard way cosme.lst, is a list in ASCII format which counts these defects. We will see in the continuation of the tutorial how to generate this file automatically. For the moment, you can download it here (this version ressence the 50 hot pixels most intense of the image dark).
We have all in hand to treat the spectra of Gamma Case (like all the acquired spectra this night there, and probably the following ones!).
SPIris has a powerful tool, especially developped at the point for the treatment of spectra LHIRES III. You must proceed in two stages.
Etape1
To give the responsability in memory the first spectrum of the sequence to be treated:
> load gcas-1
Another manner is of utilser the order number in the place of the order load. Syntax is then:
> number gcas-
To notice that we provided only the generic name. The order number turns over in the window of exit of the software the number of images present in the generic sequence of name "to altair -". Here the result is 7. Moreover, this order charges in memory and posts the first image of the sequence, which is the goal to seek. Finally number initializes certain variables of the program as we will see it in the following stage.
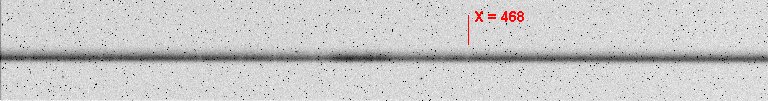
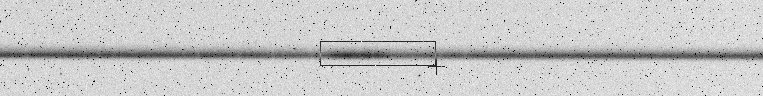
You must now select in the image which posts the spectrum by framing it with a rectangle drawn with the pointer of mouse:
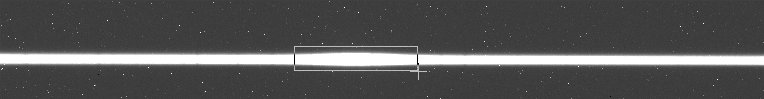
To trace to trace the rectangle, to slip with the mouse while pressing on the left button of the pointer.
What it is necessary to know:
This rectangle is used for the software to identify the spectrum and true Ca zone of influence in the image, such as the operator the judge.
Stage 2
To open limps it of Traitement dialogue of spectra LHIRES III - 2400 of small Spectro :
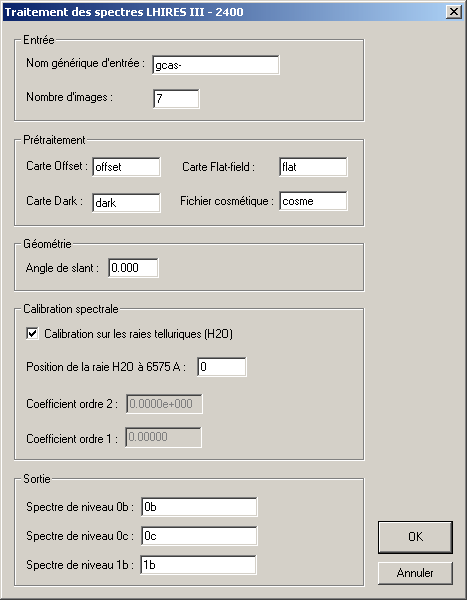
This limps of dialogue can paraitre impressive, but one should not be let intimidate! Many fields of this are déja pre-filled. It is the case for the name standrat images Masters of pretreatment. It is also the case for the generic name of the sequence of images to treat and their number if you took the precaution to launch the order number as a preliminary.
The only fields which you have to fill are:
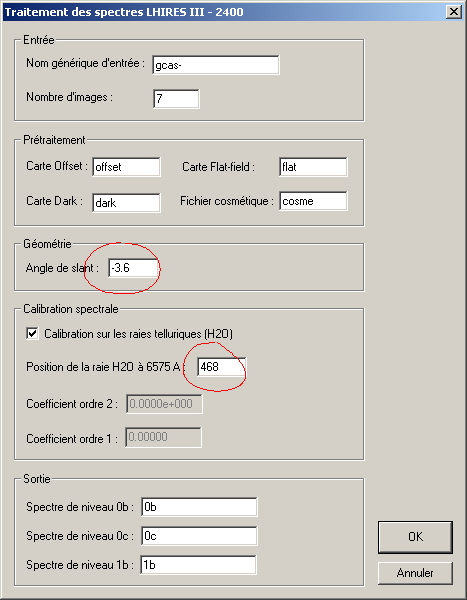
To leave all the remainder in the state.
As soon as you to click on OK, SPIris carries out a very intensive calculation. It carries out the complete pretreatment of the 7 spectra (subtraction of the offset, of the dark optimized for the exposure time, division by the flat-field, cosmetric corrections), corrects the geometry (slant and tilt), the centring of the spectra, the neat withdrawal of the bottom of sky, carries out a compositage of precision of the 7 images by elliminant the artifact effectively (cosmic rays, electronic parasites...), carries out a binning to pass from a spectrum 2d in a spectrum 1-D (spectral profile) while optimizing the signal report/ratio on noise, carries out the spectral calibration of precision while being useful of the telluric lines present in the spectrum and finally the échantillannage with constant step in wavelength.
According to the power of your computer, this treatment takes only 3 to 5 seconds!
One of the results is posted with the screen:
![]()
It is the spectral profile of the star Gamma treated Case (nap of the individual spectra with all calculations described précedemment). To facilitate visualization in the form of a speudo image 2d, the spectral profile is duplicated on 20 lines. This spectrum has in addition to a linear dispersion, which is not the case in the rough spectra. In this case, a intervale of 1 pixel following the horizontal axis precisely represents an interval of 0,1157 angströms in wavelength.
Information on the spectral calibration appears in the window of exit, which opens automatically:
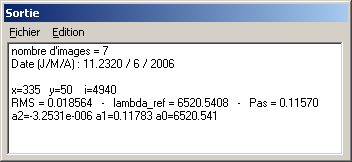
One finds there the step in wavelength, as well as the wavelength of the first pixel of the image (here 6520.5 angström). The coefficients of the second-order polynomial having been used to calibrate the spectrum in wavelength is also given. These coefficients are important to calibrate a spectrum in which the telluric lines of H20 are can visible (see the example hereafter).
A small note in connection with the precision of the spectral calibration. The residue of adjustment in quadratic term of error (parameter RMS) is 0,018 angström (difference between the wavelengths observed and those calculated with the adjusted polynomial). It is a reasonably weak error here, but it is possible to still obtain a result better by using a star having a spectral profile less tormented than that of Gamma Case, for example the Altair star. Further in this tutorial, we will devote ourselves to the treatment of a spectrum of this last object. Once the coefficients of calibration spectale obtained (a1 terms and a2), they can be Re-to use to treat other stars without having with this being useful of the telluric lines (will see we it in the following example, devoted to the star 64 Ser).
Currently, in a rough spectrum of Gamma Case, the relation between a number X of pixel and the corresponding wavelength are:

The coefficients a1 and a2 define the law of dispersion of the spectrograph. They are quasi constant instrumental the, characteristic with your spectrograph and its current adjustment. The definite a0 term the spectral chock at the time of the observation (it is the wavelength located at the left extrème of your spectrum). If you move the micrometers of the spectrograph, this value is modified. It is also modified because of the differential mechanical inflections which the spectrograph according to the point observed in the sky undergoes. Most of the time, the work completed by the software consists in calculating the term a0, the known a1 terms and a2 being supposed (we will see that with the star 64 Ser).
SPIris wrote in the repertory of work
three files, corresponding to products of level 0b, 0c and 1b.
The concept of level of product is important because it makes
it possible to break up well the stages of treatment and the degree
reached. The stages intermédiares are important to carry out
controls, but also these products intermédaires can be used such
which for certain exploitations. The levels of the spectral
products are described here.
SPIris safeguards an image of level 0b. It is the optimal sum of our 7 elementary spectra. The geometrical corrections are carried out and the bottom of sky is withdrawn. This image has as a name 0b.pic in the example, but you could have named it differently well on (for example gcas_0b).
> load 0b

The spectrum of level 0b.
SPIris safeguards also a spectrum of level 0c, which is the version 1-D spectrum of level 0b. For that, SPIris applies an optimal binning in the field of the signal report/ratio to noise.
> load 0c
![]()
Spectrum of level 0c.
Lastly, most important here, SPIris generates a product of level 1b, which is the spectral profile of star gauged in wavelength. This profile is a file simple file ASCII with two column. The first column contains the wavelengths in ansgtroms and the second column the corresponding intensity standardized (the standard is the average of the intensity of the spectrum). In our application, this file with for name in the repertory of work 1b.dat (SPIris added for you the dat extension, for good to distinguish it from the file images). Once again, you can use the name of your choice (for example gcas_1b.dat).
The contents of the file of level 1b can be seen and published with a text processing, the window of exit of SPIris/Iris, to post in the shape of a graph with Excel or any other graphics package. Especially it can be easily to transport in a software of spectral analysis, like VisualSpec, to complete the treatment and to practise analyses (controls supplémenarires, withdrawal of the instrumental answer, standardization of the continuum, measures equivalent widths of lines, etc).
Here an extract of the file 1b.dat :
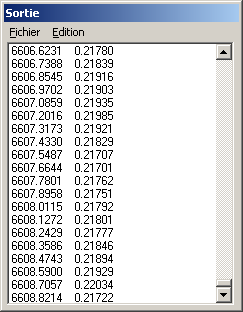
It is the contents of this file which is posted at the end of the treatment in the form of a speudo image 2d. To find it, make
> load 1b
![]()
Translation in the form of image of a product
of level 1b (linear spectral dispersion).
This stage you can have a more precise idea of the spectral profile by posting it in a written form:
> l_plot
To download the products of level 0b, 0c and 1b of Gamma Case, to click here.
3.2. Treatment of the spectrum of the star 64 Ser
The star 64 Ser (HD175869) is a star Be magnitude 5.57, therefore definitely weaker than Gamma Case Are spectrum was obtained the same night and with the same instrumentation as for the observation of Gamma Case. We have to carry out 15 spectra of this star, posed each one 300 seconds. Their generic name is "64ser -".
To confirm the number of images in the sequence to make since the console:
> number 64ser-
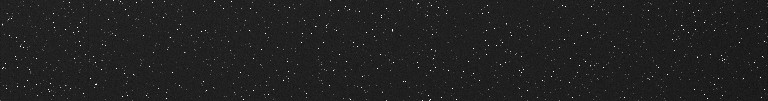
Sight into negative of one of the 15 rough
images of 64 Ser.
We can be useful ourselves of the same images Masters of calibration as for Gamma Case.
To download the rough images of 64 Ser, to click here.
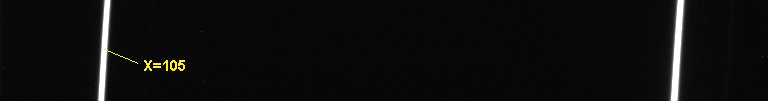
Répérer the position of line telluric H2O with 6574 a:
The identification is definitely less easy compared to Gamma Cases It is than 64 Ser is definitely less brilliant. One can despite everything the reconnaitre and to note that its position did not change. The other telluric lines are definitely weaker, and it is guessed that the software will pain to carry out the spectral calibration from those. Also we will not seek to adjust a polynomial of calibration with thin information contained in the spectrum of 64 Ser, but Re-to use the polynomial calculated at the time of the treatment of Gamma Case.
To select with the pointer of mouse the trace of the spectrum of 64 Ser:
To open then limps it of Traitement dialogue of Spectra LHIRES III - 2400 of small Spectro. The totality of the fields are already filled if you do not have to leave the application since the treatment of this last star. You have in theory simply to click on OK, one cannot make simpler! To do it not however. We want to use the parameters of spectral calibration found for the star Gamma Case, also, we ask SPIris not to recompute them. For celà, désélectionner the option Calibration on the telluric lines (H20). Ensure you however that the good position for the line with 6575 A is well provided, as well as the good coefficients of the polynomial:
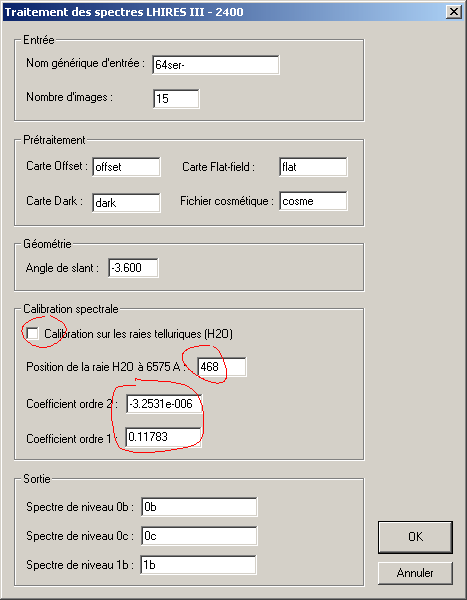
You can now click on OK.
There is an alternative method of calibration, so definitively, the telluric lines are invisible (either because the star is too weak, or because the atmosphere is too dry...).
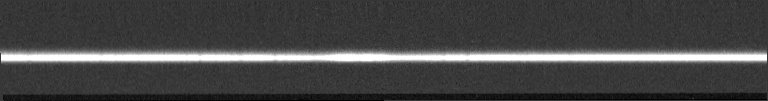
To charge the image of neon associated with the observation with 64 Ser:
> load 64ser_neon-1
Two lines of neon only are visible with our opposite dispersion of 0,115 A/pixel. Of left on the right, they are located at the wavelength of 6532,8822 A and 6598,9529 A. Repérer roughly the position of the first line along the horizontal axis by using the pointer of mouse. You to go to find X approximately = 105. Download the spectrum 64ser_neon-1.
To reload the first spectrum of the sequence of 64 Ser, to select the trace of the spectrum with the mouse, then to ourvrir limps it of Traitement dialogue of spectra LHIRES III - free of small Spectro :
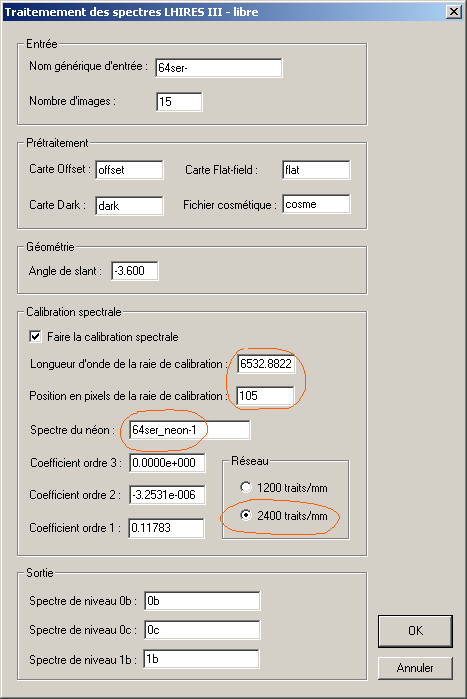
Limps is imposing, but like accustoming it, all is almost already filled.
You have all the same a small work to make:
At present, to click on OK. All the treatment until a spectral calibration of quality proceeds in a handle of seconds.
SPIris with not only treated the spectrum of 64 Ser, but also that of your lamp neon. It acts of one given intermediate, normally nonaccessible, but by way of checking (and teaching) you can see this treated spectrum (correction with the images Masters, geometrical corrections), while making:
> load @@
> load @@@
The line of neon A was used to find the parameter a0 polynomial of calibration, and to supplement the a1 terms and a2, entered like parameters of the ordering of treatment. The spectral calbration is thus possible.
To note that if you déselectionnez the Faire option the spectral calibration, SPIris generates only the products of level 0b and 0c.
Here for 64 Ser the spectrum of level 0b calculated
(to note to it quasi absence of cosmetic defects)
and the spectrum of level 0c
![]()
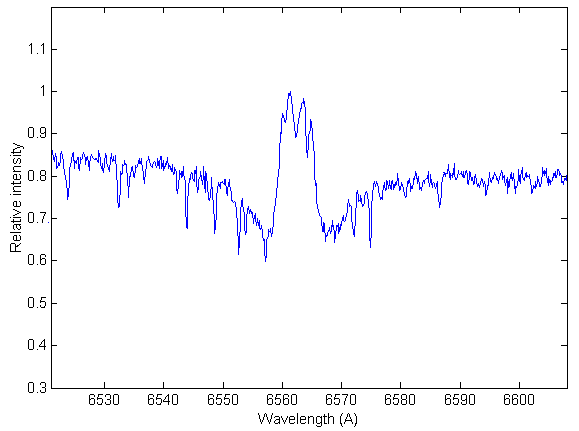
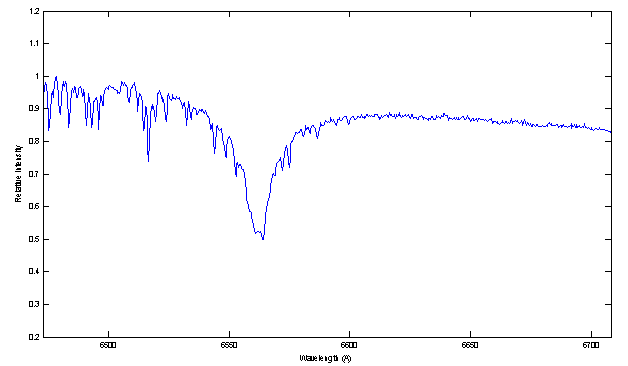
The profile of level 1b (1b.dat) was imported under software MATLAB for a graphic layout:
After a passage in the VisualSpec software, we obtain a product of level 2b (withdrawn telluric lines and standardized continuum):
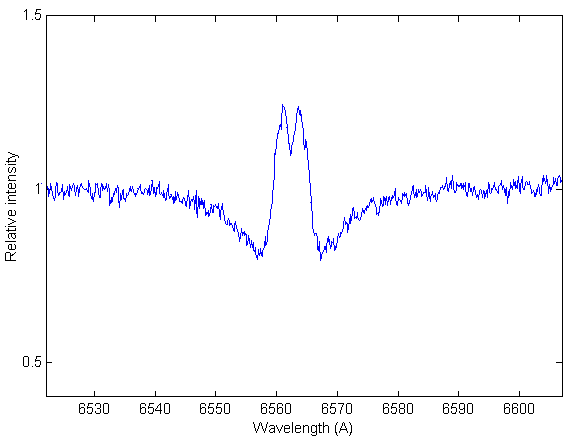
To download the products 0b, 0c, 1b and 2b of 64 Ser, to click here.
4. AUTOMATIC TREATMENT OF SPECTRA 1200 TRAITS/MM
4.1. Treatment of the spectrum of the Altair star
We treat 3 spectra of the Altair star, acquired in the night of June 30 at July 1. The spectra are posed each one 60 seconds. The spectrograph is equipped with the network of 1200 traits/mm.
To download the 3 rough images of Altair and a corresponding image of neon, to click here.
To download the images Masters for the pretreatment and the file cosme.lst, to click here.
To charge the image altair_neon-1 first of all:
> load altair_neon-1
Given that the network of 1200 traits/mm disperses less than the network of 2400 traits/mm we have this time 5 lines of neons around halpha, easily identifiable.
To note the approximate position in pixels of the first stripes on the left (along the horizontal axis).
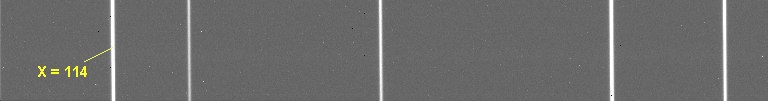
The line located with the position X = 114 pixels in our example is located at the precise wavelength of 6506.528 angströms.
SPiris will be useful of the whole of the 5 lines of neon to calibrate in wavelength our spectrum of the Altair star.
"slant" lines is accentuated definitely less than with the network of 2400 traits/mm. There is all the same a small tipping angle, which one evaluates with 0,48° (see the section).
To charge the first image of the sequence of the Altair star:
> number altair-
To select the spectrum with the mouse:
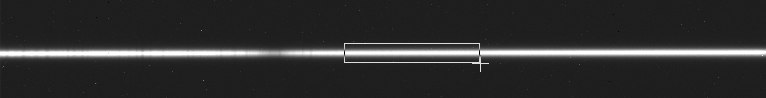
One will note in the passing that the Halpha line is not centered on the acquired spectral field It is voluntary. The goal is to record at the same time as the line Halpha (6563 A), the line of the helium located at 6678 A, located on the right part of the spectrum.
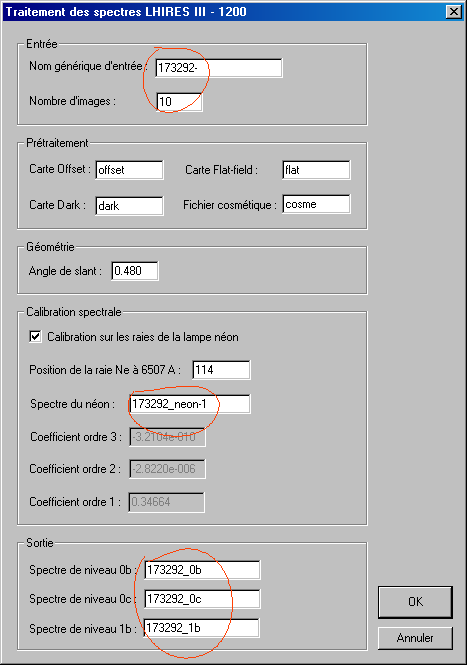
To open limps it of Traitement dialogue of spectra LHIRES III - 1200 of small Spectro :
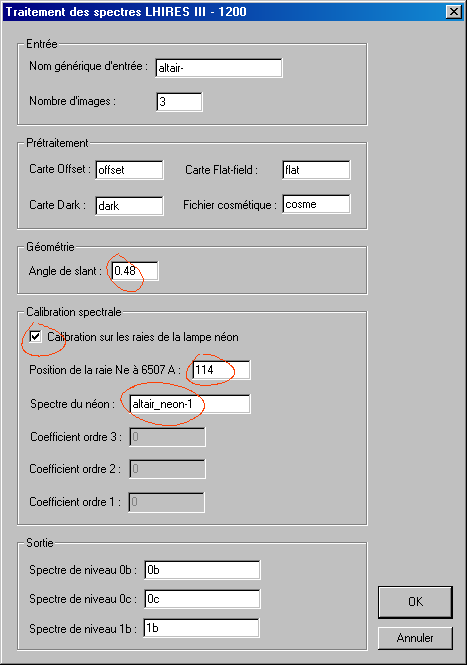
To enter the angle of slant, the position of the line of neon with 6507 A and the name of the file neon. To click on OK.
At the end of a few seconds, SPiris produces in your hard disk a spectrum 2d of level 0b, a spectrum of level 0c and a gauged spectrum of level 1b (sampled with a step of 0.344 A/pixel).
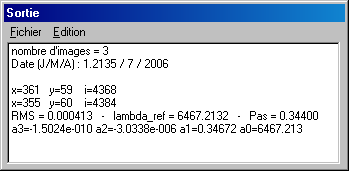
For the spectral calibration, SPiris adjusts a polynomial of degree 3 passer by to best by the position of the lines of neon. Error RMS is very weak here. The parameters of the polynomial are retrournés in the window of exit (a3, a2, a1). They can be to use to calibrate other spectra of the meeting of observation.
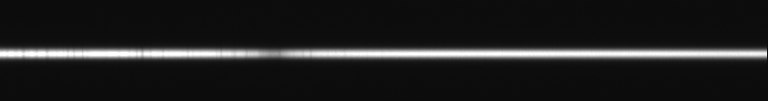
The spectrum of level 0b of Altair:
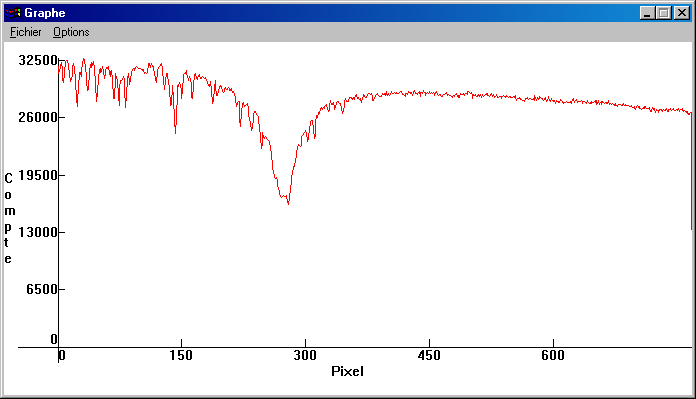
The spectrum of level 0c in graphic form (use of the order l_plot):
The product of level 1b (to notice that the spectral calibration is carried out here):
4.2. Treatment of the spectrum of star HD173292
With star HD173292 we deal with star much weaker than Altair. It is V=8.6 magnitude, which is close the magnitude reasonably atteignable with spectrograph LHIRES III equipped with the network with 1200 traits/mm. This object is a potential target of the Corot satellite.
To click here to download the rough images.
We lay out of 10 exposed rough images each one 300 seconds.
One makes:
> number 173292-
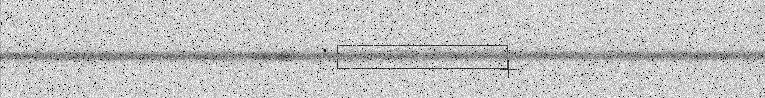
The trace of the spectrum is selected:
Then one one opens limps it of dialogue of treatment
Here the spectrum of level 0b pretreated:
and the spectrum of level 0c.
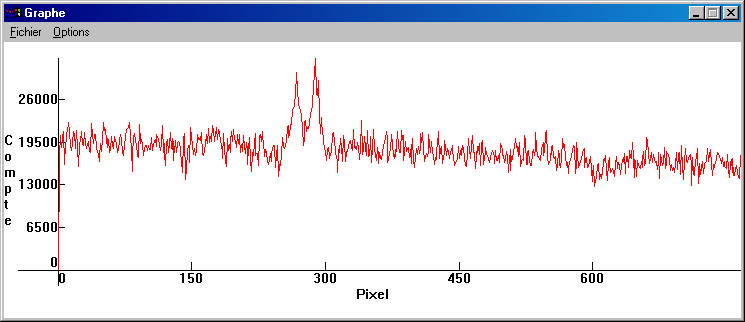
The Halpha activity is easily highlighted on this object a little extrème apès a cumulated installation 50 minutes:
< home > < continuation > Page 1/3