I wanted to make
a spectrum of a sun-spot and to compare it with the spectrum of the neighbouring
photosphere. The temperature of a sunspot, lower than photosphere, must modify
the relative intensity of the spectral lines and perhaps reveal molecular bands.
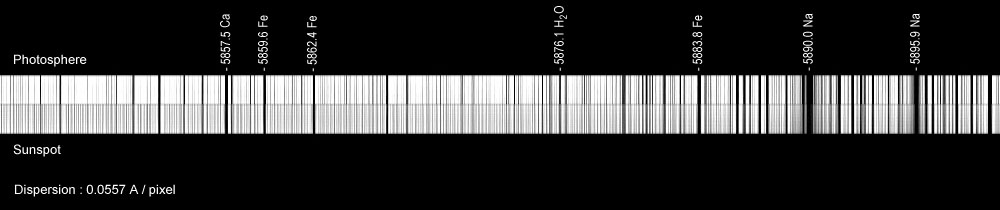
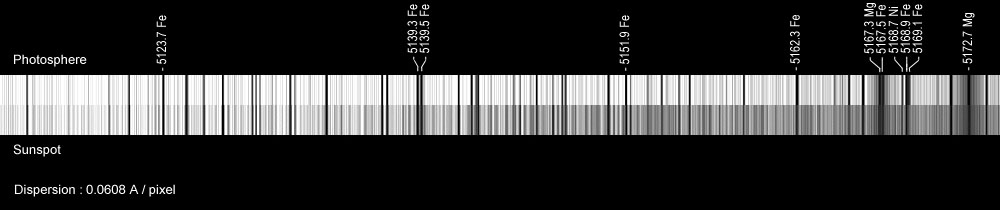
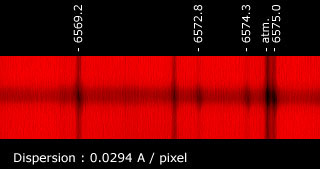
I thus took 2 spectra, one with the slit of the spectro selecting the umbra
of a sun-spot and the other with the slit selecting an area on the disc without
spot. Width of the selected line is about 10 arc-sec. Here are 2 tests, one
near the Sodium doublet and the second close to the Magnesium b2, b3 lines.
Some lines are without relationship with the Sun and originate in our atmosphere.
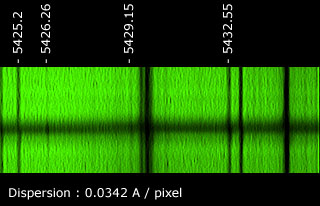
This other image, taken with a webcam, shows the reinforcement of the Ti I line (5426.26) in umbra of a sunspot
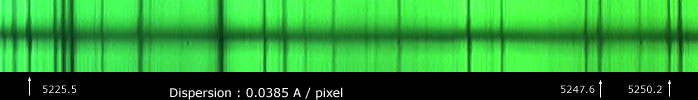
Some spectral lines are very sensitive to magnetic fields and show a neat increased width in umbra of sunspots. In fact it is a splitting of the line but spectral resolution of my spectro is often insufficient to see it. Here is a spectrum with such lines (z) on the big sunspot of AR NOAA 0330 on april 09, 2003.
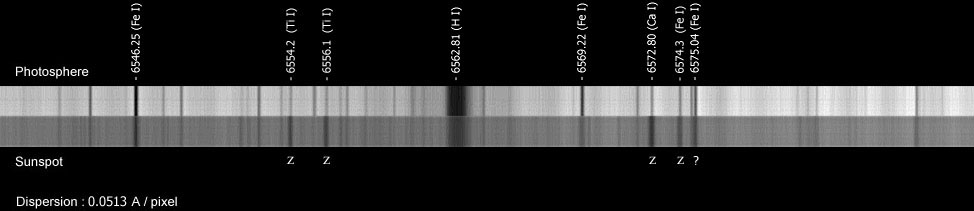
Other lines sensitive
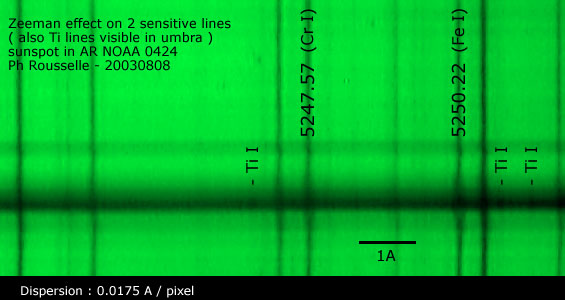
to magnetic fields (seen splitted to two in visual mode). This spectrum is a
mozaïc of 3 images took with a webcam. (AR NOAA 0424 du august 03, 2003).
an attempt with a higher
dispersion shows the splitting of these 2 lines
![]() -----
-----
![]()