|
|
|
|
|
|
WHAT IS A MTF CURVE ?
|
|
|
|
|
|
An optical instrument aims at a pattern composed of alternatively dark and bright bars (figure 1) whose spacing is adjustable. At the focus of the instrument, the image of the pattern is found again (figure 2), but the edges of the bars are less sharp and the contrast is weak : blacks became dark grey, whites became light grey.
The ratio of the contrast of the image (Ci) to the contrast of the pattern (Cp) is a excellent indication of the quality of retransmission of information by the instrument. Ideally, this ratio would be 1 : image identical to object. Un fortunately, the laws of diffraction tell us that at the focus of an instrument, the image of a light point is not a point but a figure whose size is not infinitely small. This means that even a perfect instrument is incapable of retransmitting the information with an absolute accuracy. The ratio Ci/Cp is always less than 1.

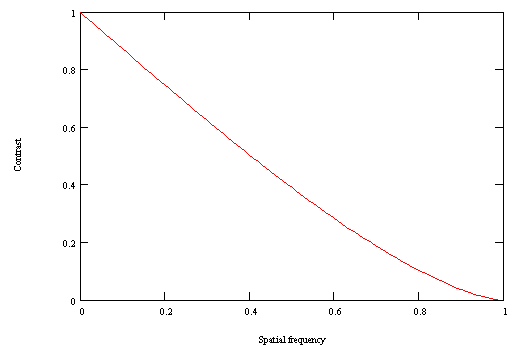
The curve above represents the value of the contrast ratio according to the spacing of the pattern bars, for a perfect instrument with no obstruction. When the spacing is very large (small spatial frequency), the instrument retransmits the information with a good accuracy : the ratio is close to 1 (left end of the curve). Then, when the spacing decreases (the spatial frequency increases), the contrast decreases (central part of the curve). Finally, when the bars are very thin (high spatial frequency), the instrument is incapable of separating them : the image is uniformly grey, without any detail (right end of the curve). The resolution limit of the instrument is attained. This maximum frequency only depends on the light wavelenght (l) and the diameter of the instrument (D), its value is (in lines pairs per radian) :
Fmax = D/l
For a 250 mm telescope, at 0.6 Ám this limit corresponds to 2 lines pairs per arc second, ie 1 line (dark or bright) for 1/4 of arc second.
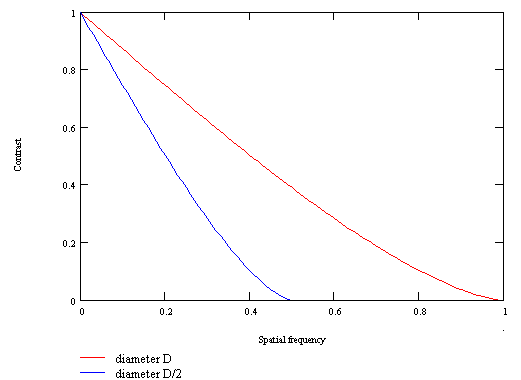
This limit frequency increases if the wavelenght decreases or if the diameter of the instrument increases. The following figure represents the MTF (Modulation Transfer Function) curves for two perfect instruments when the diameter of one of them is half of the diameter of the other. The largest telescope is able to show thinner details, its theoretical limit of resolution is twice the limit of the small instrument.

Although astronomical objects do not look like bar patterns, this type of curve gives valuable information about the performances of an instrument on celestrial objects like the planets or the Moon, because it indicates how the telescope retransmits the contrasts. The scanning of the different spatial frequencies allows to observe the behaviour of the telescope on details at different scales, the low frequencies corresponding to the large details and the high frequencies corresponding to the small details. Moreover, this type of representation allows to display the consequences of all kinds of aberrations that can affect the instrument, and even to simulate their effects on real images.